Posted by: christian on 10 Dec 2015
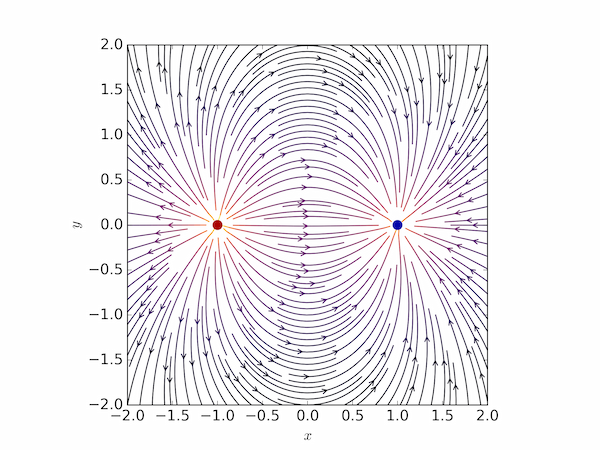
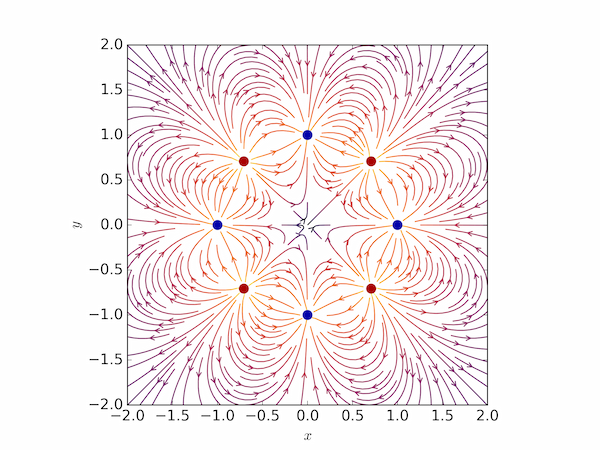
Matplotlib provides a function, streamplot, to create a plot of streamlines representing a vector field. The following program displays a representation of the electric field vector resulting from a multipole arrangement of charges. The multipole is selected as a power of 2 on the command line (1=dipole, 2=quadrupole, etc.)
It requires Matplotlib 1.5+ because of the choice of colormap (plt.cm.inferno): this can be replaced with another (for example plt.cm.hot) if using an older version of Matplotlib.
import sys
import numpy as np
import matplotlib.pyplot as plt
from matplotlib.patches import Circle

def E(q, r0, x, y):
    """Return the electric field vector E=(Ex,Ey) due to charge q at r0."""
    den = np.hypot(x-r0[0], y-r0[1])**3
    return q * (x - r0[0]) / den, q * (y - r0[1]) / den

# Grid of x, y points
nx, ny = 64, 64
x = np.linspace(-2, 2, nx)
y = np.linspace(-2, 2, ny)
X, Y = np.meshgrid(x, y)

# Create a multipole with nq charges of alternating sign, equally spaced
# on the unit circle.
nq = 2**int(sys.argv[1])
charges = []
for i in range(nq):
    q = i%2 * 2 - 1
    charges.append((q, (np.cos(2*np.pi*i/nq), np.sin(2*np.pi*i/nq))))

# Electric field vector, E=(Ex, Ey), as separate components
Ex, Ey = np.zeros((ny, nx)), np.zeros((ny, nx))
for charge in charges:
    ex, ey = E(*charge, x=X, y=Y)
    Ex += ex
    Ey += ey

fig = plt.figure()
ax = fig.add_subplot(111)

# Plot the streamlines with an appropriate colormap and arrow style
color = 2 * np.log(np.hypot(Ex, Ey))
ax.streamplot(x, y, Ex, Ey, color=color, linewidth=1, cmap=plt.cm.inferno,
              density=2, arrowstyle='->', arrowsize=1.5)

# Add filled circles for the charges themselves
charge_colors = {True: '#aa0000', False: '#0000aa'}
for q, pos in charges:
    ax.add_artist(Circle(pos, 0.05, color=charge_colors[q>0]))

ax.set_xlabel('$x$')
ax.set_ylabel('$y$')
ax.set_xlim(-2,2)
ax.set_ylim(-2,2)
ax.set_aspect('equal')
plt.show()
The electric field of a dipole: $ python efield.py 1
The electric field of an octopole: $ python efield.py 3
Comments
Comments are pre-moderated. Please be patient and your comment will appear soon.
Stafford 7 years, 6 months ago
What clever program, Loved it. I had to change the 'inferno' to 'hot' as we were warned in the opening comments. Didn't
Link | Replyrealise I was using an outdated version of matplotlib.
christian 7 years, 6 months ago
Thanks, Stafford – the issue of colormaps is one that exercises some people a great deal: for a good article about how awful the default colormap, jet, is, take a look here: https://jakevdp.github.io/blog/2014/10/16/how-bad-is-your-colormap/
Link | ReplySteven Armour 6 years, 9 months ago
Would you be opposed to me publishing a reproduction of this example that I made with the python yt lib (http://yt-project.org/) to the yt repository examples archive? (they need non-astro examples like nothing else) I have already made a prototype of what I am purposing for my E&M class last fall and would also like you to review the photo notebook as well as the final notebook to make sure there are no errors in trying to visualize the vector field volumetrically.
Link | ReplySincerly
Steven Armour
christian 6 years, 9 months ago
Not at all – you're welcome to the example and any code here you find useful. I'd be happy to take a look at the Notebook you are preparing for your EM class.
Link | ReplyBest wishes,
Christian
Youcef 6 years, 7 months ago
Hello,
Link | Replyi have some trouble running this program, it gives me this error if you can help me figure out what's the problem:
nq = 2**int(sys.argv[1])
IndexError: list index out of range
Thanks for your time
christian 6 years, 7 months ago
Hi Youcef,
Link | ReplyThe program expects the user to provide the order of the multipole on the command line (e.g. 1 for dipole, 2 for quadrupole etc.), so you should run the code with e.g.
python multipole.py 3
to plot a figure for an octopole.
Youcef 6 years, 7 months ago
Hello again Christian,
Link | ReplyI did what you told me and it worked, so thanks a lot for the help and the quick response !
good day
Joaquín 5 years, 8 months ago
Hello Christian,
Link | ReplyI am a beginner in python, what do you exactly would write in the code for a dipole ?
I know you already answered the question but i need you to be more specific please.
christian 5 years, 8 months ago
Dear Joaquín,
Link | ReplyYou need to save the code somewhere and open a command prompt (Terminal, whatever). If you navigate to the directory in which you've saved the code (on a Mac or *nix system, use the cd command; on windows I think it's chdir), you can just type:
python efield.py 1
to run the code for a dipole (2 for a quadrupole, 3 for a hexapole, etc), assuming you saved the code as efield.py and your python installation has the correct libraries installed. You might find it useful to install Anaconda (https://anaconda.org/anaconda/python) to manage your python installation.
I hope that helps,
Christian
Lina 6 years, 6 months ago
Is it possible to get the coordinates of the different streamlines ?
Link | ReplyAlso how can I interpolate between the streamlines ?
christian 6 years, 6 months ago
Hi Lina,
Link | ReplyThe call to streamplot returns a container object, stream_container, from which you can obtain the lines making up the plot as stream_container.lines, and get their coordinates from there.
If you want the lines to be closer together, you can set the density argument to streamplot when you call it, as described in the documentation: [http://matplotlib.org/api/pyplot_api.html#matplotlib.pyplot.streamplot]
Mark 6 years, 5 months ago
Perfect for creating custom field plots to add into my teaching notes.
Link | Replychristian 6 years, 5 months ago
I'm glad you find it useful – thanks for dropping by.
Link | ReplyKeith 6 years, 5 months ago
In a couple of places hypot(x,y) should be used instead of sqrt(x**2+y**2).
Link | Replychristian 6 years, 5 months ago
That's a good idea – I've made the changes.
Link | ReplyThanks, Christian
Xinyuan Wei 6 years, 3 months ago
Hello,
Link | ReplyI wonder In line 8: den = np.hypot(x-r0[0], y-r0[1])**1.5
if the exponent 1.5 should be replaced by 3?
christian 6 years, 3 months ago
Thanks for that catch, Xinyaun – you're absolutely right. I changed the previous code to use np.hypot without thinking it through. I've fixed it now.
Link | ReplyCheers,
Christian
mattes 5 years, 4 months ago
This is a nice code! But I have one question:
Link | ReplyNot any steamline is equal. This is seen in your ocutpole (right top, red pole), where one steamline is straight. I want all lines look equally. Do you know how to do this?
Cheers,
mattes
Zion_Samurai 4 years, 8 months ago
Hello, I have difficulty of plotting a magnetic dipole, could you please give me some clues?
Link | Replychristian 4 years, 7 months ago
You could look at this follow-up post: https://scipython.com/blog/visualizing-the-earths-magnetic-field/
Link | ReplyValeri Stoyanov 3 years, 8 months ago
Hi, I'm trying to run this but it comes with an error for this command: nq = 2**int(sys.argv[1])
Link | ReplyError: Traceback (most recent call last):
File "C:\Users\valer\Documents\test\vectorfieldVisual.py", line 20, in <module>
nq = 2**int(sys.argv[1])
IndexError: list index out of range
christian 3 years, 8 months ago
As stated in the description, you need to provide the multipole as a power of 2 on the command line. For example,
Link | Reply"python efield.py 1"
Sergio 3 years, 8 months ago
Hi!, i am having the same problem, kinda new to this so not quite sure to what you mean whit the need to provide the multipole on the command line, if you can help it would be great.
Link | ReplyAlso taking an EM course so this come handy, tnks
christian 3 years, 8 months ago
How are you executing the code? In an IDE or from an online service or from a terminal session?
Link | ReplyMaxim 2 years, 12 months ago
How can I do the same thing, but choose the sign of the charges on my own, for example, for two positive charges or three negative ones, and so on?
Link | Replychristian 2 years, 12 months ago
The charge values and positions are set in a loop near the beginning of the code. Change:
Link | Replycharges.append((q, (np.cos(2*np.pi*i/nq), np.sin(2*np.pi*i/nq))))
to append tuples of the form (q, (x, y)) to the list charges instead of this line, which is for alternating charges on the unit circle.
e.g. this quadrupole:
charges = [(2, (0, 0)), (-1, (0, 1)), (-1, (0,-1))]
Maxim 2 years, 12 months ago
Thank you very much!
Link | ReplyGlenn 2 years, 11 months ago
Good work! Can I ask what argument to add in order to change the position of the charges from the origin?
Link | Replychristian 2 years, 11 months ago
The charges are defined in the list of tuples called charges: each tuple gives the charge number and position: (q, (x, y)): you can set (x, y) as you like. In the code above, they are set to lie on the unit circle:
Link | Replyfor i in range(nq):
q = i%2 * 2 - 1
charges.append((q, (np.cos(2*np.pi*i/nq), np.sin(2*np.pi*i/nq))))
Glenn 2 years, 11 months ago
Can I adjust the placement of the charges while still maintaining the unit circle? The unit circle seems to change while I edit the tuples [] even though I haven't change the ((q, (np.cos(2*np.pi*i/nq), np.sin(2*np.pi*i/nq)))) part...
Link | ReplyThank you very much.
Fernando Ramos 2 years, 9 months ago
Hi Christian!, I appreciate your code. It's useful!. But I have question about your definitions. Can you explain that?
Link | ReplyFirst question: I dont understand the parameter "*charge"
in the for loop :
for charge in charges:
ex, ey = E(*charge, x=X, y=Y)
Ex += ex
Ey += ey
in the case that I eliminated " * " from " * charge" in the definition of the callback function , and then I run the scripts, It doesnt work . What is the meaning (or function )of "*charge" ?
Second question: What is the way to use r0?. I understand that define in this case (0,0), but if I need to create a (x,y) position, How can I do ? . In your code you only define in the "E function", but never more you use r0.
Thank you for sharing!
christian 2 years, 9 months ago
The syntax *charge unpacks the tuple charge into the argument list of the function E:
Link | ReplyE(*charge, x=X, y=Y)
is the same as
E(charge[0], charge[1], x=X, y=Y)
where the items inside charge are the charge value (charge[0]) and the charge position, r0 (charge[1]). In other words, r0 is set to the value determined by each charge in turn as the function is called.
I hope that helps!
Martin Nieto 2 years ago
Great code! I adapted it for my visualization of the magnetic field of a circular current loop.
Link | ReplyFrans 1 year, 9 months ago
Great code. Would like to visualize the vector field between a point and an object (preferably a 3D mesh). Could you give some tips?
Link | ReplyNew Comment