Posted by: christian on 12 Jan 2016
A simple model of a forest fire is defined as a two-dimensional cellular automaton on a grid of cells which take one of three states: empty, occupied by a tree, or burning. The automaton evolves according to the following rules which are executed simultaneously for every cell at a given generation.
- A burning cell turns into an empty cell
- A cell occupied by a tree becomes a burning cell if any of its eight neighbouring cells are burning
- A cell occupied by a tree becomes burning with a probabilty $f$ (even if none of its neighbouring cells are burning), as though struck by lightning
- An empty cell becomes occupied by a tree with probability $p$.
The model is interesting as a simple dynamical system displaying self-organized criticality. The following Python code simulates a forest fire using this model for probabilities $p = 0.05$, $f = 0.001$. A Matplotlib animation is used for visualization.
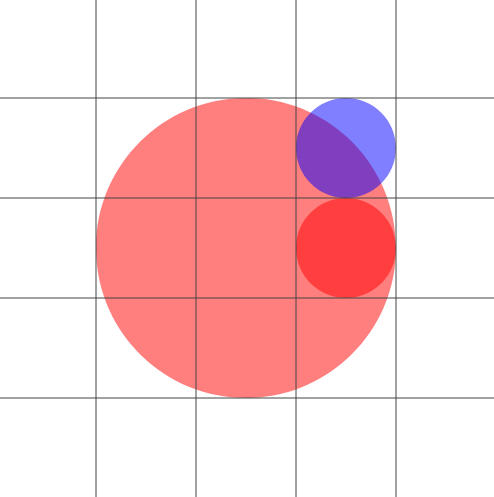
Update (January 2020): As noted by Casey (comment, below), the simulation isn't very realistic for small $f$: fires in a dense forest tend to expand out in a square pattern because diagonally-adjacent trees catch fire as readily as orthogonally-adjacent trees. This can be improved by assigning a probability of less than 1 for these trees to ignite. It isn't obvious what probability to assign, but I use 0.573 below. This is the ratio $B/A$, where $B$ is the area of overlap of a circle of radius $\frac{3}{2}$ at (0,0) (the tree on fire) with one of radius $\frac{1}{2}$ at $(0,\sqrt{2})$ (blue, the diagonally-adjacent tree), and $A$ is the overlap of this first circle with one of radius $\frac{1}{2}$ at $(0,1)$ (red, the orthogonally-adjacent tree). $A$ is equal to the "area" of this adjacent tree, since its circle is contained in the first.
This code is also available on my github page.
import numpy as np
import matplotlib.pyplot as plt
from matplotlib import animation
from matplotlib import colors

# Create a forest fire animation based on a simple cellular automaton model.
# The maths behind this code is described in the scipython blog article
# at https://scipython.com/blog/the-forest-fire-model/
# Christian Hill, January 2016.
# Updated January 2020.

# Displacements from a cell to its eight nearest neighbours
neighbourhood = ((-1,-1), (-1,0), (-1,1), (0,-1), (0, 1), (1,-1), (1,0), (1,1))
EMPTY, TREE, FIRE = 0, 1, 2
# Colours for visualization: brown for EMPTY, dark green for TREE and orange
# for FIRE. Note that for the colormap to work, this list and the bounds list
# must be one larger than the number of different values in the array.
colors_list = [(0.2,0,0), (0,0.5,0), (1,0,0), 'orange']
cmap = colors.ListedColormap(colors_list)
bounds = [0,1,2,3]
norm = colors.BoundaryNorm(bounds, cmap.N)

def iterate(X):
    """Iterate the forest according to the forest-fire rules."""

    # The boundary of the forest is always empty, so only consider cells
    # indexed from 1 to nx-2, 1 to ny-2
    X1 = np.zeros((ny, nx))
    for ix in range(1,nx-1):
        for iy in range(1,ny-1):
            if X[iy,ix] == EMPTY and np.random.random() <= p:
                X1[iy,ix] = TREE
            if X[iy,ix] == TREE:
                X1[iy,ix] = TREE
                for dx,dy in neighbourhood:
                    # The diagonally-adjacent trees are further away, so
                    # only catch fire with a reduced probability:
                    if abs(dx) == abs(dy) and np.random.random() < 0.573:
                        continue
                    if X[iy+dy,ix+dx] == FIRE:
                        X1[iy,ix] = FIRE
                        break
                else:
                    if np.random.random() <= f:
                        X1[iy,ix] = FIRE
    return X1

# The initial fraction of the forest occupied by trees.
forest_fraction = 0.2
# Probability of new tree growth per empty cell, and of lightning strike.
p, f = 0.05, 0.0001
# Forest size (number of cells in x and y directions).
nx, ny = 100, 100
# Initialize the forest grid.
X  = np.zeros((ny, nx))
X[1:ny-1, 1:nx-1] = np.random.randint(0, 2, size=(ny-2, nx-2))
X[1:ny-1, 1:nx-1] = np.random.random(size=(ny-2, nx-2)) < forest_fraction

fig = plt.figure(figsize=(25/3, 6.25))
ax = fig.add_subplot(111)
ax.set_axis_off()
im = ax.imshow(X, cmap=cmap, norm=norm)#, interpolation='nearest')

# The animation function: called to produce a frame for each generation.
def animate(i):
    im.set_data(animate.X)
    animate.X = iterate(animate.X)
# Bind our grid to the identifier X in the animate function's namespace.
animate.X = X

# Interval between frames (ms).
interval = 100
anim = animation.FuncAnimation(fig, animate, interval=interval, frames=200)
plt.show()
Here is a short animation of the forest fire created by this program.
Share on Twitter Share on Facebook
Comments
Comments are pre-moderated. Please be patient and your comment will appear soon.
Stafford Baines 8 years, 1 month ago
Looks interesting. I'll have to peruse it a bit more to see what makes it tick.
Link | ReplyCoincidently I'm working on a vaguely similar idea which I call 'deer park'. N deer are introduced onto a park and move move around the park randomly. The brown deer
eat the green grass which turns black and remains black for n steps after which it 'regrows'. Each deer has a weight index W which can increase to a maximum M if grass is available and decreases otherwise. If W reaches zero the deer is no more. The idea is to see if by varying the various parameters a stable deer population can found. Later additions may include predators and possibly the affect of weather - droughts slowing the rate of growth of the grass.
christian 8 years, 1 month ago
Sounds like an interesting project. Let me know what you find!
Link | ReplyAdam Wolniakowski 7 years, 1 month ago
Reminds me of old Wa-Tor simulator designed by A. K. Dewdney: https://en.wikipedia.org/wiki/Wa-Tor
Link | ReplyHe used fish vs. sharks populations.
christian 7 years, 1 month ago
That's really interesting – I had not seen it before. I might see if I can adapt this code to model the Wa-Tor system.
Link | Replychristian 7 years, 1 month ago
Here is my implementation of the Wa-Tor population dynamics model: http://scipython.com/blog/wa-tor-world/ Thanks for the tip-off about it.
Link | ReplyAdam Wolniakowski 7 years, 1 month ago
That's really cool!
Link | ReplyIf you're into cellular automata, you could also take a look into Wireworld: https://en.wikipedia.org/wiki/Wireworld
I am currently trying to make an interactive compiler to work with the Wireworld computer (https://www.quinapalus.com/wires11.html)
christian 7 years ago
I remember Wireworld from some reading I did a long time ago (Martin Gardner?) – your project sounds interesting (and hard...)
Link | ReplyI like your JavaScript programs on the Forest Fire model and Langton's Ant as well, by the way. When I get the time, I might try to implement something in Python for this site as well.
Pedro Henrique Duque 4 years, 9 months ago
Is the code complete? I am trying to run it, but I only get the initial image, without fire. Where do you use the probabilities of new tree growth and lightning strike?
Link | Replychristian 4 years, 9 months ago
The code runs OK under my environment (Python 3.5 / Anaconda). The probabilities p and f are used in the function iterate() which picks them up in global scope. If you let me know what Python version and libraries you have installed, I might be able to help.
Link | ReplySara 2 years, 10 months ago
I have the same problem , I only get the initial image and I work in python 3 / JupyterLab
Link | Replychristian 2 years, 10 months ago
I can reproduce this in Jupyter Notebook. I do see the animation if I use
Link | Reply%matplotlib notebook
after the imports, though. There's a SO question about this at https://stackoverflow.com/questions/25333732/matplotlib-animation-not-working-in-ipython-notebook-blank-plot
Casey 3 years, 11 months ago
Hi Christian. I think I found a bug in your code - the physics looks a little wrong to me. Your "neighborhood" considers any tree next to a tree currently on fire, in any orientation that is a multiple of 45-degrees. This allows your code to spread the fire in subsequent timesteps if fire exists etc. My issue with it is that you are allowing the fire to grow "faster" in the 45-deg, 135-deg, 225-deg, and 315-deg directions. This is because the neighborhood you specify is a square, not a circle. The "edges" of your neighborhood are 1.41ish times closer to the "fire" than your "corners" are if that makes sense. This allows your fire to spread faster in the corner directions (X/Y together) than it does in just X or Y exclusively. I tested this by running your code with f set to 0.00001. At the beginning of the sim, the forest grows to be dense, until one or two lightning strikes occur. Because there are very few sources of fire, it is clear that it grows like a square, when in reality (in a real forest) it would grow like a circle, progressing radially from the strike. So even though the simulation you have in the attached video looks great, the fire actually spreads faster in certain directions than in others.
Link | ReplyI'm interested in this problem for a project I'm working on. I'm primarily interested in finding an extremely fast way to run this algorithm once to completion for a pre-defined "forest" with pre-defined fire locations and no random generation of trees or lightning strikes. I would be really interested to hear your thoughts on this. And cool code, thanks for sharing!
christian 3 years, 11 months ago
Hi Casey,
Link | ReplyYou're right, of course: the orthogonally- and diagonally-adjacent cells are not treated quite correctly. I guess a fix might be to assign a probability < 1 of the fire spreading to a diagonal cell when a given tree is on fire. For example, some factor related to the ratio A/B of A=the overlap of a circle of radius 2r at (0,0) with one of radius r at (0,r) and B=the overlap of this first circle with one of radius r at (r, 1.414r).
In any case, I'm not sure how quantitative this model can really be and how applicable it is to real life (there's no wind, terrain, all the trees are the same, etc.); but I'd be interested to hear how you get on with your project.
Cheers, Christian
New Comment